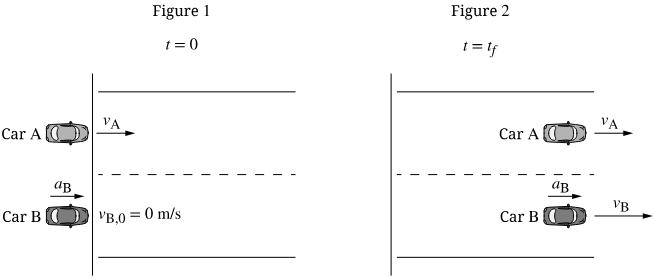
How far from photogate 1 should photogate 2 be placed to get 0.12 s between gates?
Use the constant-acceleration particle model to:
Cart, inclined ramp, 2 photogates + timer, meterstick, tape, angle finder (optional), data table.
Titles
Procedures and data
labeled tables/graphs
units
best-fit lines
clear conclusion & reflection questions
Use graphs and equations to solve word problems
Use velocity time graphs to model motion and make predictions.
Graphs of velocity versus time during 4 seconds for identical objects are shown below.

Rank the magnitudes of the displacements of the objects during each of these intervals.
Use velocity time graphs to model motion and make predictions.
Use velocity vs. time graphs to solve Kinematic problems
For each of these cases, if any, is...at the indicated point?
Model motion graphically
Make predictions of motion from VT Graphs
The graphs below show the velocity versus time for boats traveling along a straight, narrow channel. The scales on both axes are the same for all of these graphs. In each graph, a point is marked with a dot.

Rank the magnitude of the velocity of the boat at the point indicated. Explain your reasoning.
Model and represent uniform motion graphical
The position-time graph shown represents the motion of two children who are moving along a narrow, straight hallway.
Model Uniform motion graphically
Represent changing velocity motion
Finish Fan Cart Data Collection & Analysis
__
Create and interpret velocity vs. time graphs
A red car (top) and a green car (bottom) are having a race. The green car has a
A red car (top) and a green car (bottom) are having a race. The green car has a head start (distance a). The two cars start at the same time. The red car must travel
A red car (on left) and a green car (on right) are spaced
Each graph below shows the position of an object as a function of time.

Interpret position vs. time graphs, pictorially, graphically, mathematically, and narratively
Practice with distance and displacement
Define average vs. instantaneous
Define position, distance, and displacement
Model consistent motion
Model motion of a toy car
Collect data on your buggies so that you can represent the motion (all aspescts) of both buggies on the same graph. Your final models should be able to predict the position of your buggy at specified times.
Does your Buggy move in a consistent manner? [Define consistent]
You will be given scenario card that describes the setup of your buggies
Establish Board Meeting Norms
Collect data on your buggies so that you can represent the motion (all aspescts) of both buggies on the same graph. Your final models should be able to predict the position of your buggy at specified times.
You will be given scenario card that describes the setup of your buggies
Learn quality data collection techniques
Engage in scientific discussion
Use graphs and data to answer questions
Introductions
Classroom Culture
(Yes this is the game Connections)
Determine whether the coefficient of restitution,
Title and objective of the experiment:
Theoretical background:
Hypotheses:
Is the coefficient of restitution constant for your ball? Do this by comparing drop height to bounce height for your assigned ball.
The coefficient of restitution (symbol:
background: black